Tidyverse Practice
Duration: ~45 Minutes

Learning Objectives
- Manage a project
- Prepare a dataset for analysis
- Save a script as a record of your data prep
Download the data
Fatality Analysis Reporting System, NYS, 2015
Source: FARS website
Copy the data
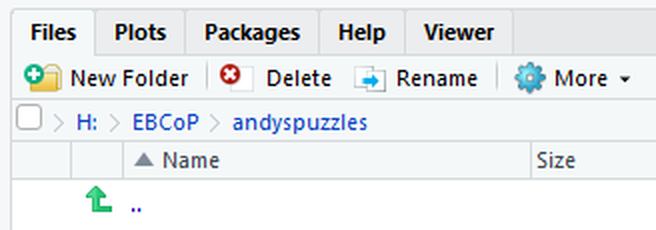
- Navigate to your project folder
- Create 2 folders:
dataandR - Copy your downloaded CSV to
data
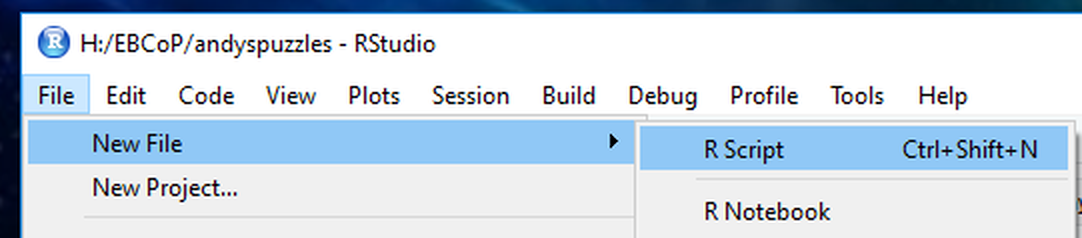
Create a new script file
Go to: "File" > "New File" > "R Script"
Create a header
Simple ...
# Author: Abby
# Date: 19 April 2019
# Project: Data management with tidyverse workshop
# Purpose: To practice piping and dplyr
# Data source: FARS person level data, 2015
... or click the down arrow for elaborate ...
#========================================================================#
# Author:  Abigail Stamm (GitHub ID: ajstamm)                            #
# Date:    Friday, 19 April 2019                                         #
# Project: Data management with tidyverse, an R workshop offered by the  #
#          NYS DOH Epidemiology and Biostatistics Community of Practice  #
# Purpose: To practice basic piping and common dplyr commands            #
# Data source: FARS person level data, 2015, https://www.nhtsa.gov/      #
#              research-data/fatality-analysis-reporting-system-fars     #
#========================================================================#
Load packages
Load tidyverse.
It will auto-load dplyr.
library(tidyverse)
Load data
Use read.csv() (base R) or
read_csv() (tidyverse).
Differences between them are beyond the scope of this workshop.
fars <- read_csv("raw_data/fars2015nys_person.csv",
                 col_types="ccccccnccccccccc")
Options vary. To see them, query ?.
Subset data
Select only observations in Albany (where COUNTY = 1).
FARS uses FIPS codes.
my_fars <- fars %>% filter(COUNTY == 1)
Keep only relevant variables
Drop the following variables:
DOA, SEAT_POS, STATE
my_fars <- my_fars %>%
  select(-DOA, -SEAT_POS, -STATE)
Rename your variables
Change the following variable names:
ST_CASE tocase_num PER_NO toperson_num VEH_NO tovehicle_num
my_fars <- my_fars %>% rename(case_num = ST_CASE,
                              person_num = PER_NO,
                              vehicle_num = VEH_NO)
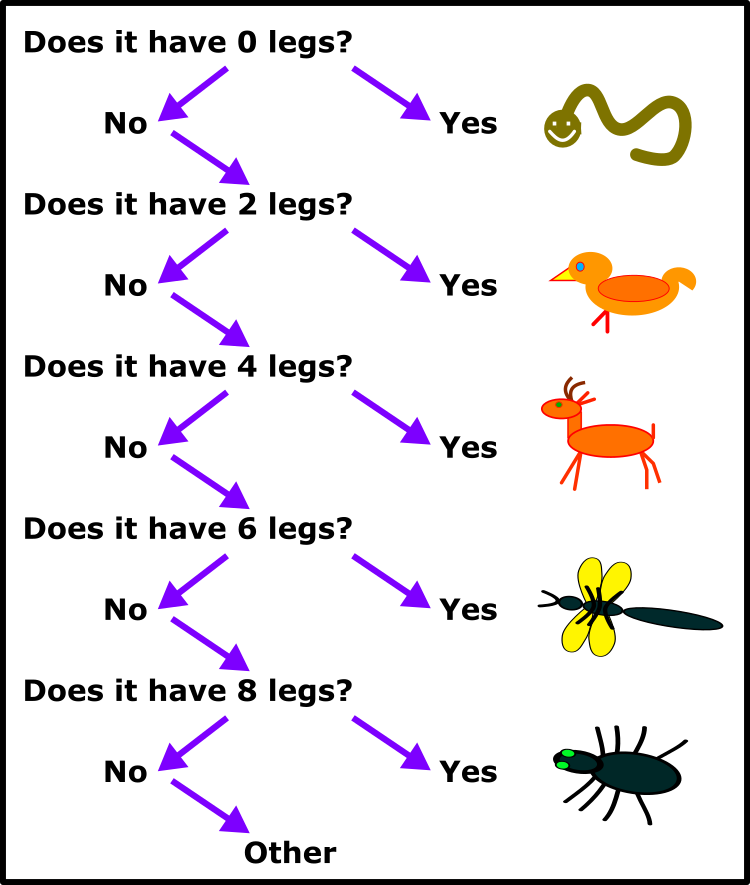
Side Note: ifelse()
For conditional statements
- only 2 conditions
- chain condition pairs
legs <- c(0,2,0,4,2,6,4,8,6,8)
y <- ifelse(legs == 2, "bird",
            "not bird")
Try it yourself.
z <- ifelse(legs == 0, "snake",
     ifelse(legs == 2, "bird",
            "other"))
Create new variables
- Create a logical `driver` variable, where TRUE means the person was a driver (PER_TYPE = 1).
- Create a categorical `agegroup` variable to identify if the person was:
- child (12 and below)
- adolescent (13-19)
- young adult (20-29)
- middle-aged (30-64)
- older adult (65 and up)
- unknown (999)
Click the down arrow for the code.
Create new variables code
my_fars <- my_fars %>%
  mutate(
    driver = (PER_TYP == 1),
    agegroup = ifelse(AGE == 999, NA,
               ifelse(AGE < 13, "child",
               ifelse(AGE < 20, "adolescent",
               ifelse(AGE < 30, "young adult",
               ifelse(AGE < 65, "middle-aged",
               ifelse(AGE >= 65, "older adult", NA))))))
    )
Rearrange the data
Arrange the data by RACE and HISPANIC.
my_fars <- my_fars %>% arrange(RACE, HISPANIC)
Check the first few rows. What do you notice?
Put the code together
Combine all steps.
- load the data
- subset only Albany County
- drop state, seat position, index, and dead on arrival
- rename vehicle, case, and person number
- create driver and age group
- sort by race and ethnicity
Click the down arrow for the code.
fars <- read_csv("raw_data/fars2015nys_person.csv",
                 col_types="ccccccnccccccccc")
my_fars <- fars %>%
  filter(COUNTY == 1) %>%
  select(-DOA, -SEAT_POS, -STATE) %>%
  rename(case_num = ST_CASE, person_num = PER_NO,
         vehicle_num = VEH_NO) %>%
  mutate(driver = (PER_TYP == 1),
         agegroup = ifelse(AGE == 999, NA,
                    ifelse(AGE < 13, "child",
                    ifelse(AGE < 20, "adolescent",
                    ifelse(AGE < 30, "young adult",
                    ifelse(AGE < 65, "middle-aged",
                    ifelse(AGE >= 65, "older adult",
                    NA))))))
  ) %>% arrange(RACE, HISPANIC)
Save your data
Save to data. Use a meaningful name.
write.csv(my_fars, "data/fars2015nys_AlbanyCounty_person.csv",
          row.names = FALSE)
And Now You Know!

Next up: Summarizing data