Data.Frames
- Learn more code
- ~45 Minutes
- Participant survey
Learning Objectives
- Definition
- Creation
- Import CSV data
- Indexing
- Deletion
- Further Learning
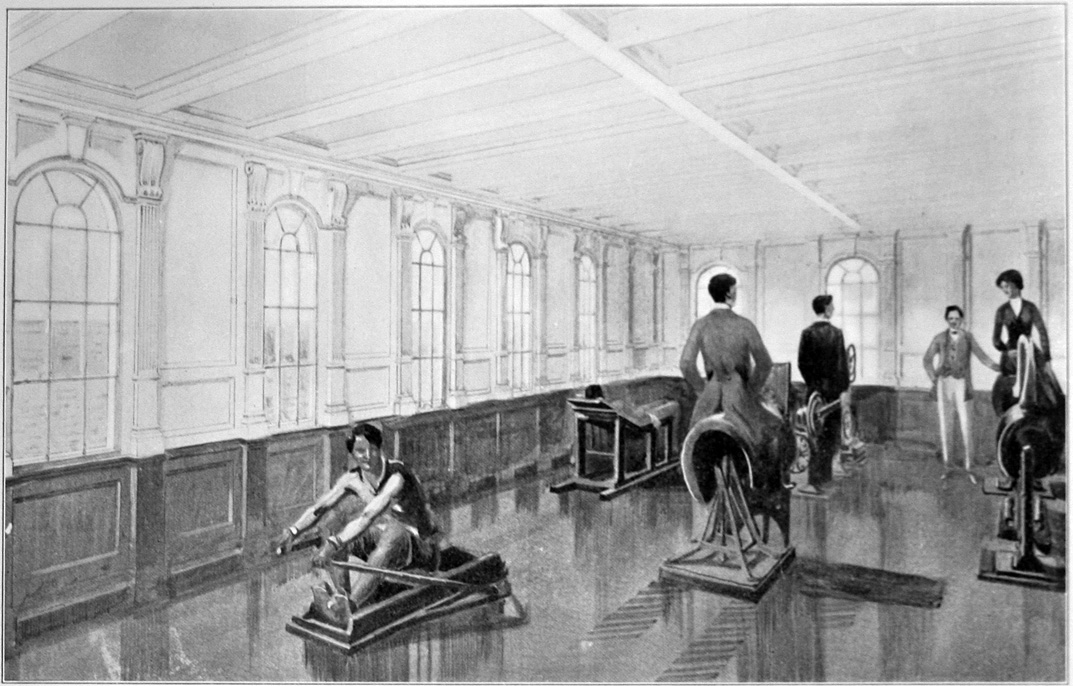
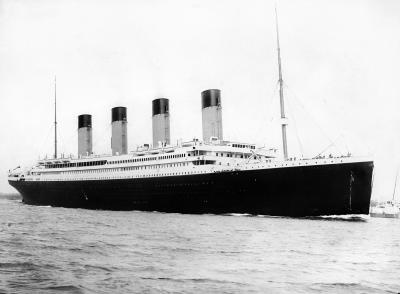
Drawing of the Titanic gymnasium
What is a Data.Frame
- N dimensional object
- Column = same class & length
- Row = different classes
- Easier to manage than vectors
- Explicit relationship between entries

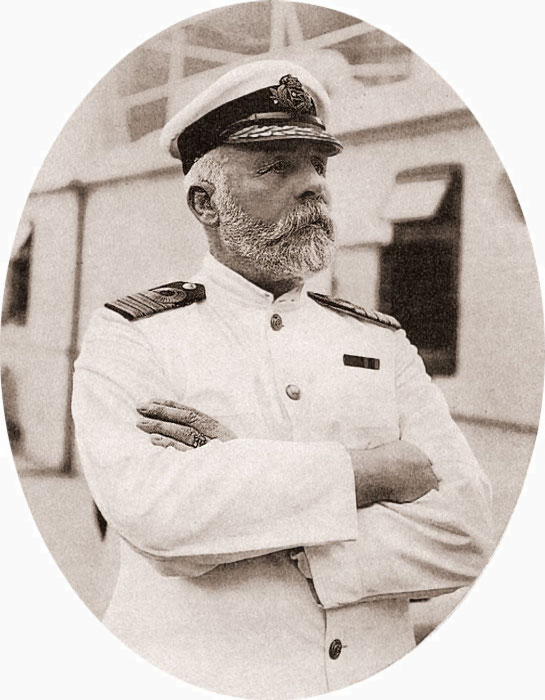
Paperboy Ned Parfett, Soldier and Paperboy
Creation[1]
Works best when you copy/paste
## First we need some vectors
age <- c(22,38,26,35,35,NA,54,2,27,14)
gender <- c("male","female","female","female","male",
            "male","male","male","female","female")
survived <- c(FALSE,TRUE,TRUE,TRUE,FALSE,
              FALSE,FALSE,FALSE,TRUE,TRUE)
Creation[2]
Combine the vectors.
passengers <- data.frame(age, gender, survived)
View(passengers)
   age gender survived
1   22   male    FALSE
2   38 female     TRUE
3   26 female     TRUE
4   35 female     TRUE
5   35   male    FALSE
6   NA   male    FALSE
7   54   male    FALSE
8    2   male    FALSE
9   27 female     TRUE
10  14 female     TRUE
 Your Turn!
## What does this tell us?
dim(passengers)
[1] 10  3

## 10 == Number of Rows
##  3 == Number of Columns
## This is ALWAYS the order!
Import CSV data
- R can import data, from CSV, Excel, Databases, etc.
## Import data from CSV.
## This WILL overwrite the data.frame we made a few minutes ago!
url <- "http://choens.github.io/titanic/public/data/passengers.csv"
passengers <- read.csv(url)
head(passengers)
Your Turn!
## Spend some quality time with the following commands.
## ? is a great way to read the documentation.
dim(passengers)
names(passengers)
summary(passengers)
str(passengers)
View(passengers)
head(passengers)
tail(passengers)
Let us know if you need help!
Reuse What You Know!
- Functions adapt to the data type (Object Oriented)
- Both of the following code segments work
head(survived)
[1] FALSE TRUE TRUE TRUE FALSE FALSE
head(passengers)
  passengerid survived pclass                                                 name    sex age embarked
1           1        0      3                              Braund, Mr. Owen Harris   male  22        S
2           2        1      1  Cumings, Mrs. John Bradley (Florence Briggs Thayer) female  38        C
3           3        1      3                               Heikkinen, Miss. Laina female  26        S
4           4        1      1         Futrelle, Mrs. Jacques Heath (Lily May Peel) female  35        S
5           5        0      3                             Allen, Mr. William Henry   male  35        S
6           6        0      3                                     Moran, Mr. James   male  NA        Q
Indexing
- Back to square brackets
- Critical:
passengers[ROW,COLUMN]
## Returns one row by row #.
passengers[10, ]
   PassengerId Survived Pclass                                Name    Sex Age Embarked
10          10        1      2 Nasser, Mrs. Nicholas (Adele Achem) female  14        C
## Returns one column by name.
passengers[ ,"age"]
  [1] 22.00 38.00 26.00 35.00 35.00    NA 54.00  2.00 27.00 14.00  4.00 58.00
 [13] 20.00 39.00 14.00 55.00  2.00    NA 31.00    NA 35.00 34.00 15.00 28.00
 [25]  8.00 38.00    NA 19.00    NA    NA 40.00    NA    NA 66.00 28.00 42.00
 [37]    NA 21.00 18.00 14.00 40.00 27.00    NA  3.00 19.00    NA    NA    NA
 [49]    NA 18.00  7.00 21.00 49.00 29.00 65.00    NA 21.00 28.50  5.00 11.00
 [61] 22.00 38.00 45.00  4.00    NA    NA 29.00 19.00 17.00 26.00 32.00 16.00
 [73] 21.00 26.00 32.00 25.00    NA    NA  0.83 30.00 22.00 29.00    NA 28.00
 [85] 17.00 33.00 16.00    NA 23.00 24.00 29.00 20.00 46.00 26.00 59.00    NA
 [97] 71.00 23.00 34.00 34.00
Just Give Me A Vector!
## There is an easier way to refer to a single column
## A single column IS a Vector.
passengers$age
passengers$age
  [1] 22.00 38.00 26.00 35.00 35.00    NA 54.00  2.00 27.00 14.00  4.00
 [12] 58.00 20.00 39.00 14.00 55.00  2.00    NA 31.00    NA 35.00 34.00
 [23] 15.00 28.00  8.00 38.00    NA 19.00    NA    NA 40.00    NA    NA
 [34] 66.00 28.00 42.00    NA 21.00 18.00 14.00 40.00 27.00    NA  3.00
 [45] 19.00    NA    NA    NA    NA 18.00  7.00 21.00 49.00 29.00 65.00
 [56]    NA 21.00 28.50  5.00 11.00 22.00 38.00 45.00  4.00    NA    NA
 [67] 29.00 19.00 17.00 26.00 32.00 16.00 21.00 26.00 32.00 25.00    NA
 [78]    NA  0.83 30.00 22.00 29.00    NA 28.00 17.00 33.00 16.00    NA
 [89] 23.00 24.00 29.00 20.00 46.00 26.00 59.00    NA 71.00 23.00 34.00
[100] 34.00
The Real Power Is Boolean
- A Boolean test on a vector returns a vector of TRUE/FALSE/NA the same length as the vector
- We can use this vector as a filter
- Let's do this together!
## This should tell us that passengers has 250 rows.
dim(these_passengers)

my_filter <- passengers$survived == 1
these_passengers_lived <- passengers[my_filter,]

## This should be less than 250.
dim(these_passengers_lived)
Your Turn!
## Using passengers, create a new data.frame of "children".
## Define children as passengers where age < 18.
Answer on the next slide!
Your Turn!
## Define children as passengers where age < 18.
## Unlike last time - I did this as one step.
children <- passengers[passengers$age < 18, ]
summary(children)
  passengerid       survived       pclass                                      name        sex          age         embarked
 Min.   : 8.00   Min.   :0.0   Min.   :2.000   Andersson, Miss. Erna Alexandra   : 1   female:11   Min.   : 0.830       : 0
 1st Qu.:18.50   1st Qu.:0.0   1st Qu.:2.250   Caldwell, Master. Alden Gates     : 1   male  : 7   1st Qu.: 4.000   C   : 3
 Median :47.50   Median :0.5   Median :3.000   Ford, Mr. William Neal            : 1   NA's  :22   Median : 9.500   Q   : 2
 Mean   :45.50   Mean   :0.5   Mean   :2.722   Goodwin, Master. William Frederick: 1               Mean   : 9.435   S   :13
 3rd Qu.:67.75   3rd Qu.:1.0   3rd Qu.:3.000   Goodwin, Miss. Lillian Amy        : 1               3rd Qu.:14.750   NA's:22
 Max.   :87.00   Max.   :1.0   Max.   :3.000   (Other)                           :13               Max.   :17.000
 NA's   :22      NA's   :22    NA's   :22      NA's                              :22               NA's   :22
Your Turn!
## What does ls() do?
ls()
Crosstabs!
Very useful when working with categorical data.
## This command works with ONE vector . . .
table(passengers$sex)

## Or Two
table(passengers$sex, passengers$survived)

## Or More! This one is a little weird.
table(passengers$sex, passengers$survived,
      passengers$passenger_class)

## This is more readable. A function inside a function!
ftable(table(passengers$sex, passengers$survived,
       passengers$passenger_class))
Your Turn!
Were men and women equally likely to survive the Titanic?
## - chisq.test() is the command to run the Chi Squared Test.
## Don't worry about calculating the percents.
Answer on the next slide!
Your Turn!
chisq.test( passengers$sex, passengers$survived )
	Pearson's Chi-squared test with Yates' continuity correction

data:  passengers$sex and passengers$survived
X-squared = 36.585, df = 1, p-value = 1.461e-09
Tabular Margins and Percents
In these commands 1 ALWAYS means "over rows" and 2 ALWAYS means "over columns"
Margins
## Margins are Totals.
tbl <- table(passengers$sex,
             passengers$survived)
mbl <- margin.table( tbl, margin=1)
mbl
female   male
   107    143
Margins
## Prop = proportion.
tbl <- table(passengers$sex,
             passengers$survived)
pbl <- prop.table( tbl, margin=1)
pbl
               0         1
  female 0.2803738 0.7196262
  male   0.7692308 0.2307692
You _can_ do this without the intermediaries!
Your Turn!
Can you figure out how to round the proportions?
## Try the round command!
Answer on the next slide!
Your Turn!
Can you figure out how to round the proportions?
## Try the round command!
tbl <- table(passengers$sex, passengers$survived)
pbl <- prop.table( tbl, margin=1)
round(100*pbl,1)
            0    1
  female 28.0 72.0
  male   76.9 23.1
Deletion
- This is thankfully EASY
## Always clean up after yourself.
rm(children)
Further Learning
-
This workshop is just . . . the tip of the iceberg.
Sorry. I had to. I really had to. -
Recommended R Resource: Quick-R
- Same guy who wrote R In Action
-
Read:
"
Why R has A Steep Learning Curve"
Which is a review of the challenges faced by SAS/SPSS users during their to transition to R
Your Turn!
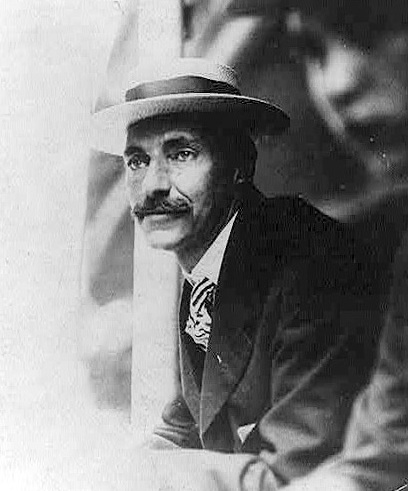
John Jacob Astor IV in 1919
1. Try your new skills in your work.
2. At the DOH? Join EBCoP!
3. Please complete the workshop survey
4. Are there specific skills you want to learn in R? Email us!