Relational Database Practice
Duration: ~30 Minutes

Learning Objectives
- Merge datasets on a key
- Summarize merged dataset
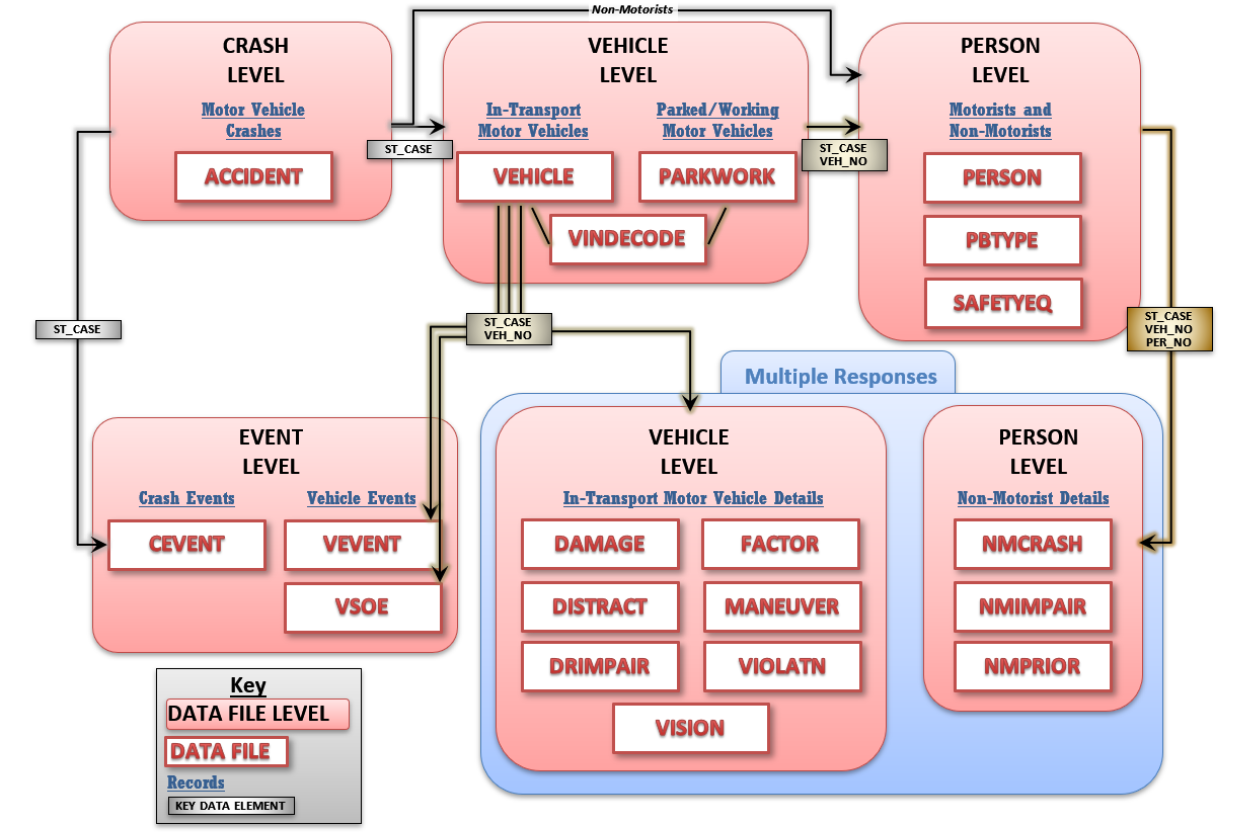
Structure of FARS database
Prepare your project
- Create a new R script file in your project folder
- Add a heading
- Load tidyverse
- Download the datasets
Datasets we will use
Load datasets
accident <- read_csv("Data/fars2015nys_accident.csv",
                     col_types="cnccnccnnnnnnncccccc")
vehicle <- read_csv("Data/fars2015nys_vehicle.csv",
                    col_types="ccccncnnccnccc")
person <- read_csv("Data/fars2015nys_person.csv",
                   col_types="cccncccccccccc")
Reduce your variables
Remove the following extra variables before merging.
- Accident: latitude and longitude
- Vehicle: make, model, year, vehicle identification number, deformed, and travel speed
- Person: drinking, drugs, dead on arrival, and seat position
Code for removing variables
Hint: use select().
accident <- accident %>%
  select( -LATITUDE, -LONGITUD )
The code below is a variation on what you've already learned.
vehicle <- vehicle %>%
  select( -(MAKE:VIN), -(TRAV_SP:DEFORMED) )
person <- person %>%
  select( -(DRINKING:DOA), -SEAT_POS )
Join the datasets
Hint: identify the keys. You can join on more than one variable at a time.
Click the down arrow for code.
Joining code
my_fulldata <- accident %>%
  full_join(vehicle, by = "ST_CASE") %>%
  full_join(person, by = c("ST_CASE", "VEH_NO", "ST_CO_FIPS"))
Variation 1: Only people in cars
Suppose you only want vehicle occupants. How will you join or filter the datasets to exclude everyone else?
One possible solution is below.
my_peopleincars <- accident %>%
  full_join(vehicle, by = "ST_CASE") %>%
  inner_join(person, by = c("ST_CASE", "VEH_NO", "ST_CO_FIPS"))
Variation 2: only pedestrians
Multiple possible methods:
- Select people from the full dataset who were not in the vehicle dataset.
- Select only non-drivers/non-passengers in person dataset, then left join to the accident dataset.
- Or think of something else.
Code to isolate pedestrians
My suggested methods give different results. Why? What can I do about it?
## method 1
my_pedestrians1 <- my_fulldata %>%
  filter( is.na(NUMOCCS) )  # I picked a random variable
                            # unique to the vehicle dataset.
                            # Why might this not work?
## method 2
my_pedestrians2 <- person %>%
  filter( !PER_TYP %in% c("driver", "passenger") ) %>%
  left_join(accident, by = c("ST_CASE", "ST_CO_FIPS"))
What's going on?
What's up with the discrepancy?
Let's learn another useful function.
pedestrian_test <- my_pedestrians2 %>%
  anti_join(my_pedestrians1, my_pedestrians2, by=c("ST_CASE", "PER_NO"))
anti_join() selects all cases that are in only one dataset.
Type ?anti_join to learn more.
Check your data
Check if your dataset only contains pedestrians. Which variable could you use?
I will provide two solutions on the next slide, one with base R and one with tidyverse.
Code to check your data
You could use base R,
table(my_pedestrians2$VEH_NO)
... or you could use tidyverse.
my_pedestrians2 %>% group_by(VEH_NO) %>% summarize(total = n())
Explore: why were pedestrians hit?
Some possible hypotheses to test:
- time of day
- weather
- location relative to road
- type of intersection
Let's explore these.

Let's explore time of day
The dataset includes hour and daylight. Your question would dictate
which is more appropriate. My question is,
"Are pedestrians most likely to be hit during the day, at night, or in between?"
To answer this, evaluate the variable LGT_COND.
Create a summary table with count and proportion of pedestrian deaths by time of day.
Code for time of day
my_pedestrians3 %>% group_by(LGT_COND) %>%
  summarize(total = n(), percent = 100*total/nrow(.))
How could we change the code to look at time of day by whether the pedestrian died?
my_pedestrians3 %>% group_by(LGT_COND, died = INJ_SEV=="fatal") %>%
  summarize(total = n(), percent = 100*total/nrow(.))
Your turn!
Investigate one or more of these variables.
- county
- location relative to the road
- type of intersection by whether on foot
- type of road
- weather by time of day
Recode:
- Was it an intersection? yes/no
- Was the weather clear? yes/no
Raise your hand if you have questions or need help.
Test your knowledge
Create a dataset with the following:
- Number of deaths per county
- Number of pedestrian deaths per county
- Number of accidents per county
- Average deaths per accident by county
- Average vehicles per accident by county
Answer these questions using your dataset.
- Which county had the highest number of deaths per accident?
- Which county had the highest number of deaths overall?
- Which county had no fatal vehicle accidents in 2015?
Answers:
- Ulster
- Suffolk
- Hamilton, Orleans
Hint for Question 3: NYS fips codes here
One possible solution:
Create the dataset
my_countydata <- my_fulldata %>% group_by(ST_CO_FIPS) %>%
  summarize(
    Total_Deaths = sum(INJ_SEV == "fatal", na.rm=TRUE),
    Pedestrian_Deaths = sum(INJ_SEV == "fatal" & VEH_NO == 0,
                            na.rm=TRUE),
    Total_Accidents = length(unique(ST_CASE)),
    Avg_Death_Accident = Total_Deaths / Total_Accidents,
    Avg_Ped_Death_Accident = Pedestrian_Deaths / Total_Accidents
  )
Click down for answers.
One possible solution:
Answer the questions
# highest avg deaths per accident
my_countydata %>% arrange(-Avg_Death_Accident)
# most deaths
my_countydata %>% arrange(-Total_Deaths)

# check who is missing
# first create a data frame of all county fips codes
allfips <- data.frame(ST_CO_FIPS = seq(36001, 36123, by=2))
# Then check if all fips codes are in our dataset
allfips %>% filter(!ST_CO_FIPS %in% my_countydata$ST_CO_FIPS)
And Now You Know!
